
The BC government is hiding Covid-19 data for cases, hospitalization status and deaths based on Covid-19 “vaccine” status.
On July 28, 2022 the secretive BC NDP took away more transparency from the public saying everyone but the government is too stupid to understand the Covid-19 statistics.
The announcement was posted on the covid-19 surveillance dashboard landing page saying the outcomes “by vax” and “donut charts” have been “retired.”
There is not reason given for the decision to remove the data from the public eyes which has caused confusion for many British Columbian residents.

“These indicators were initially created because we wanted to identify breakthrough infections as we were ramping up the vaccination campaign. As most of the population has now been vaccinated with at least two doses of vaccine and many more have been infected with COVID-19, the data became hard to interpret.” a Ministry of Health spokesperson told CTV News when asked the reason.
The information that was displayed on the charts showed a break down of Covid-19 cases, hospitalizations and deaths based on vaccination status but these statistics are “all-cause” meaning it also rolls in incidental statistics which is a logical fallacy when trying to understand what is going on.
These statistics that Bonnie Henry and the BC Government have been releasing since the first day of the data coming out are not the true numbers. Bonnie Henry even admitted at least 50% of the numbers are all incidental. The data is not split to show the numbers of what is actually from the symptoms of Covid versus someone being admitted for a broken and just happened to test positive with Covid-19.
Sample of the data
The first set of donut charts showed the percentage of how many people were hospitalized, admitted to critical care and deaths grouped by vaccination status. In these charts we can see the triple vaccinated group vast majority accounted for each group for positive cases, hospitalizations, critical care admissions and deaths.
People with three shots of the Covid vaccine account for 75% of deaths while 14% of the deaths were in the people with 2 doses of the “vaccine”. only 0.7% of deaths were among the people with 1 dose of the vaccine and the people that did not get a covid shot account for 14%. CTV News even acknowledges this in their report.
This chart as you can see in the screen grab is the update showing the data from May 8, 2022 to July 2, 2022

The next set of sample charts we are going to show are screen grabs from May 15, 2022 to July 9 2022. These charts will show the number of deaths by age group based on Covid-19 vaccination status.
In this first image we are looking at data from May 15, 2022 to July 9 2022 only ages 0 to 49. According to the BC government data we can see there is a higher number of so-called “fully vaccinate” plus “fully vaccinated and boosted” people that are dying.

In this next sample from the same week May 15, 2022 to July 9 2022 only ages 50+ years old. We can see there is a dramatic increase of deaths in the older age group and a vast majority of them are triple jabbed. We are not done looking at these charts of data though.

You don’t need to be a genius to understand these numbers are showing the people dying are old people. This next graph is a little bit of order data but still relevant from this year just for some perspective.

What the data shows us
It’s very clear the majority of the people testing positive, being hospitalized, sent to critical care and dying are people with 2 doses of the vaccine or more. Keep in mind the vaccinated group is a larger section of the population proving to us that the covid-19 “vaccine” doesn’t stop the spread like it was claimed in the beginning by health officials and politicians.
If we drill down deeper in to the data we do see the group that have zero doses of the Covid-19 “vaccine” do indeed have a higher rate of adverse outcomes per 100,000 people.
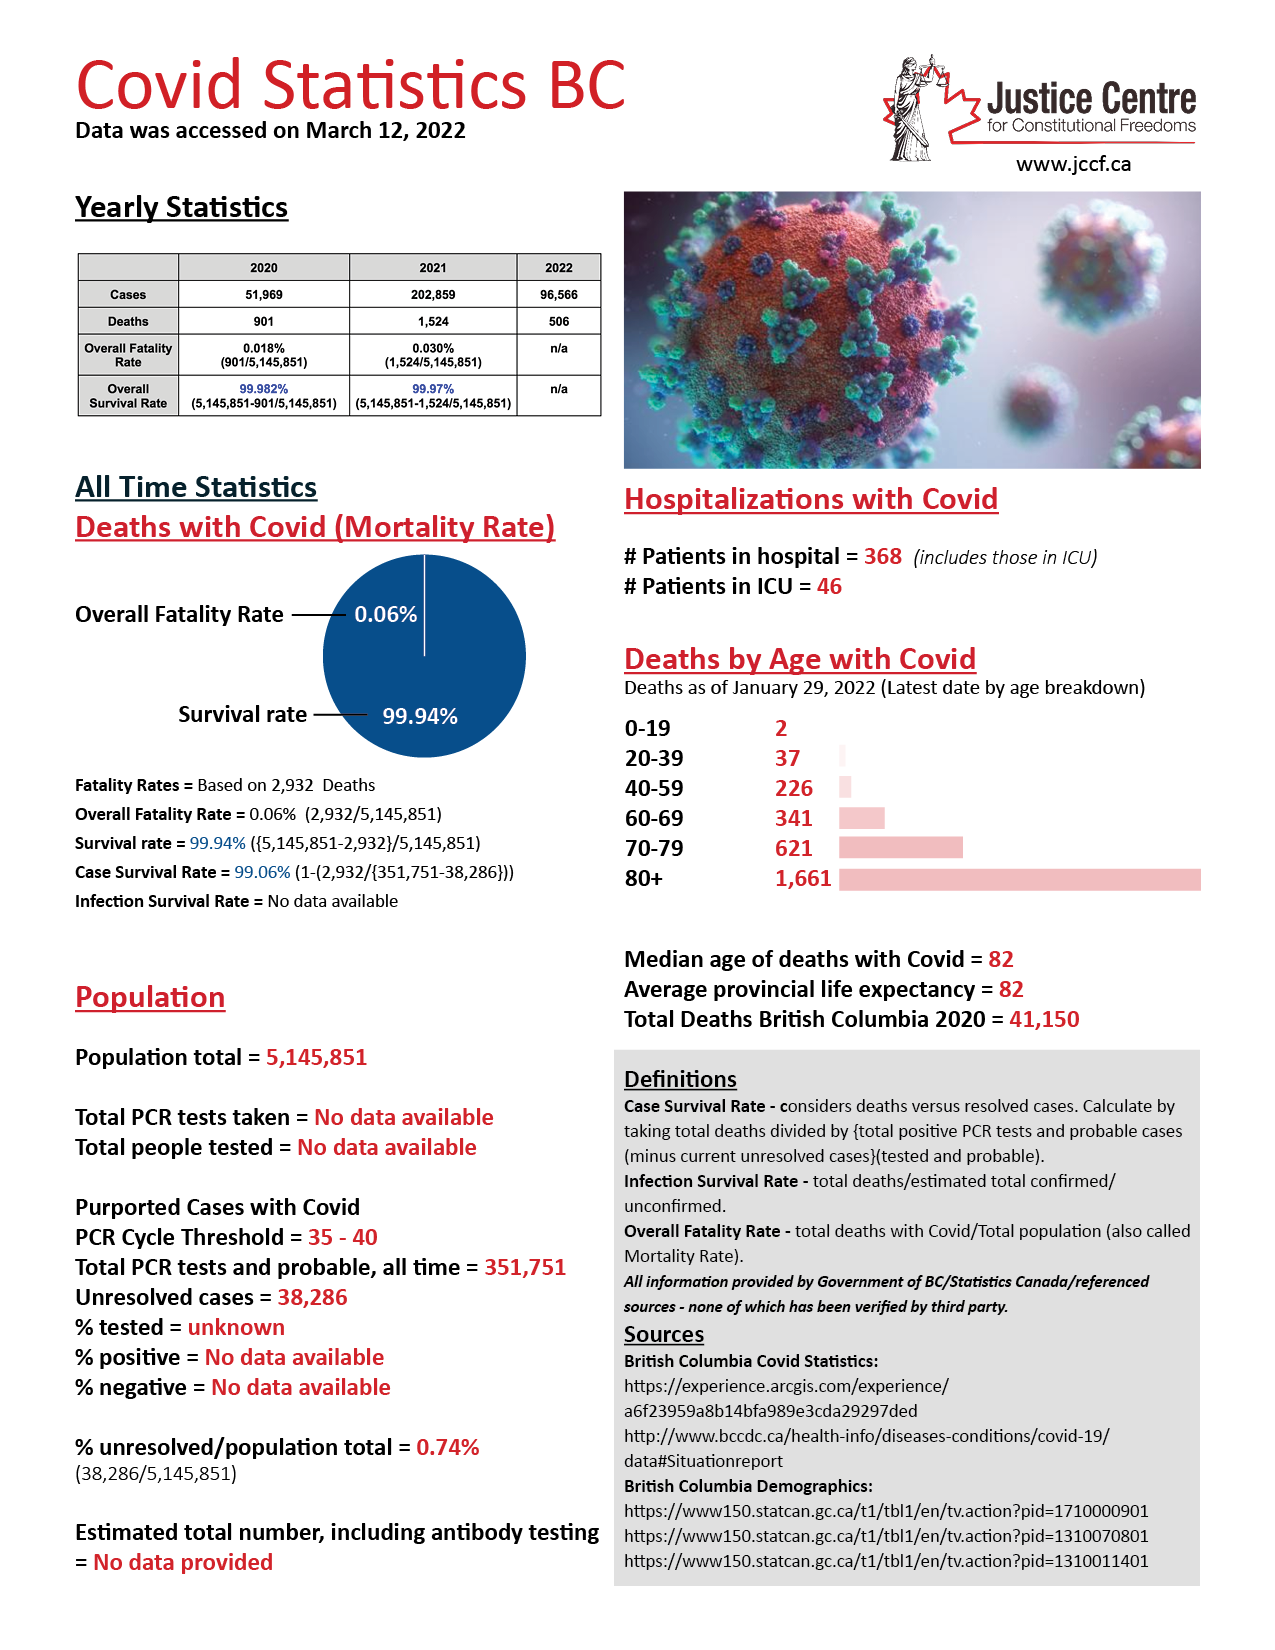
Now using the government data released to JCCF in a freedom of information act request we get to view the statists from the beginning of the pandemic up to the date this chart was released in March 2022.
What do we notice? the overall fatality rate is 0.06% while the survival rate is a staggering 99.94%, these number do not represent and age group or compromised groups as it is just an overall.
But on the right hand side of this data we can see a break down deaths by Age with Covid and the numbers are as followed. age group 0 to 19 there is 2 deaths, age group 20 to 39 there is 37 deaths, ages 40 to 59 we see 226 deaths, ages 60-69 there is 341 deaths followed by 621 deaths for ages 70 to 79 and last there is 1,661 for 80+.
Now that we have seen a sample of the data with a quick run down of the statistics and remembering the mention of incidental cases, we begin to see something else immerging.

Although CTV News acknowledges the “vaccinated” groups are the majority counted in all of the statistics they also mention because there is a high vaccination rate so that is why we see more of the vaccinated accounted for in the statistics. One thing they fail to mention though is we have always had a very low vaccination rate for kids and with that low vaccination rate we still see very low numbers of death hovering around ZERO.
The way to break it all down is you first get the over all numbers grouped by vaccination status, then split them in to the respective age groups. From there the next step would be to axe 50% of the numbers to account for the incidental cases. After we have removed the incidental cases because they are from the cause of Covid there is still another step to take.
The very last break down is to take the 50% that is not incidental and begin to break it down further by risk of severe illness group. Most people do not know what the risk of severe illness groups are and how it works even though there was data released on it back in January 2022.
Severe illness risk groups
This is where we start to learn our own personal risk of severe illness from Covid-19 to make educated decisions about our own health, which doctors are supposed to having these conversations with their patients but have been failing at.
Bonnie Henry released the risk chart during a Covid-19 update in January of this year which BC Rise reported. What we learn in that data release contrary to what we were being told and still being told to this day is a majority of the population is actually low to very low risk of sever illness.
The way we came to this conclusion was breaking down all the population counts using Statistics Canada to get the population numbers as a whole and broken down by age groups. Armed with that knowledge we then need to drill in to this neat little chart Dr. Bonnie Henry provided with a break down of severe illness risk levels based on at risk conditions and age groupings.
According to the BC governments own data and charts provided to the public when we compare the zero at risk conditions sections, ages 0 to 20 are very low risk of severe illness form Covid-19 with zero doses of the Covid-19 “vaccine” and still lower risk of severe illness from Covid-19 than age group 20 to 39 when they have 2 doses.
During all the Covid-19 briefings where information is read to the public all these details have been neglected and are not shown or spoken to the public. To see the full report of the B.C. COVID-19 analysis check out the report here.

Knowing all this, are kids really “high risk” like the government claims? Absolutely not. Young people and healthy people are not all default “high risk” of sever illness from Covid-19. To get the Covid shot or not is purely a personal choice thing after knowing your own personal risk/benefit analysis of severe illness from Covid-19 vs adverse reactions from the Covid-19 vaccine.
This is why the vax status group donut charts were removed
Now we will get in to why the charts were removed from the BC Covid-19 surveillance dashboard.
According to CTV News the ministry said the data had “become hard to interpret and needed to be discontinued” and listed 3 reasons.
The firs thing the ministry noted was omicron is much more infectious and spread rapidly while evading immunity from the Covid-19 shots and positive infection case counts are likely much higher than reported because there is not enough capacity for to test all possible cases. With knowing there is likely there is more cases than being reported drives down the rates of hospitalizations compared to positive cases for both “vaccinated” and “unvaccinated” individuals.
“With the Omicron variant, we don’t have a complete understanding of the case burden in the population, given the use of rapid, point-of-care tests,” the ministry told CTV News.
Second, according to the ministry, “many of the cases in hospital are incidental findings.” which we covered earlier in this article. Incidental findings are people who have tested positive for Covid-19 but are not experiencing any symptoms or being hospitalized or died because of Covid-19, they just happened to test positive while visiting the hospital for other reasons which accounts for about half of the total all the cases.
BC Rise reported Dr. Bonny Henry confessing the Covid-19 statistics were inflated because of incorporating the incidental numbers in the mix.
“After one year since the COVID vaccines have become available for Canadians B.C. is finally admitting the COVID hospitalization numbers don’t tell the full story of who’s in the hospital because of COVID or incidentally tested positive for covid during admission or while already in the hospital for Covid unrelated issues.” reported BC Rise.
CTV News acknowledges this in their report “Health officials have previously estimated that about half of the people reported in hospital with COVID-19 at any given time were hospitalized for reasons unrelated to the coronavirus and tested positive incidentally.”
The third thing the ministry covered in their response to CTV News was because time lines of vaccination and infections vary for all individuals across the board.
“The timelines of when different groups of people received their last dose of vaccine and/or when infection occurred are now quite variable and comparing provides inaccurate results.”
The ministry then referred CTV News to vaccine effectiveness studies summarized on the BCCDC website, which have been out dated for quiet some time now. The data was from September 2021 to February 2022, nearly six months ago and posted on March 8.
“Vaccine effectiveness is a more rigorous and systematic way to assess the vaccine outcomes and assess the strength of protection from the vaccine,” the ministry said, adding that such studies also “take longer to conduct.”
According to CTV News, the ministry did not say when the next vaccine effectiveness study would be posted.
The ministry claims to CTV News the Vax donuts data was created to identify “breakthrough” infections and in doing so we all learned that the Covid-19 “vaccine” does not stop or slow the spread.
“These indicators were initially created because we wanted to identify breakthrough infections as we were ramping up the vaccination campaign. As most of the population has now been vaccinated with at least two doses of vaccine and many more have been infected with COVID-19, the data became hard to interpret.” the ministry spokesperson wrote to CTV News.
